Machine Learning for Professionals
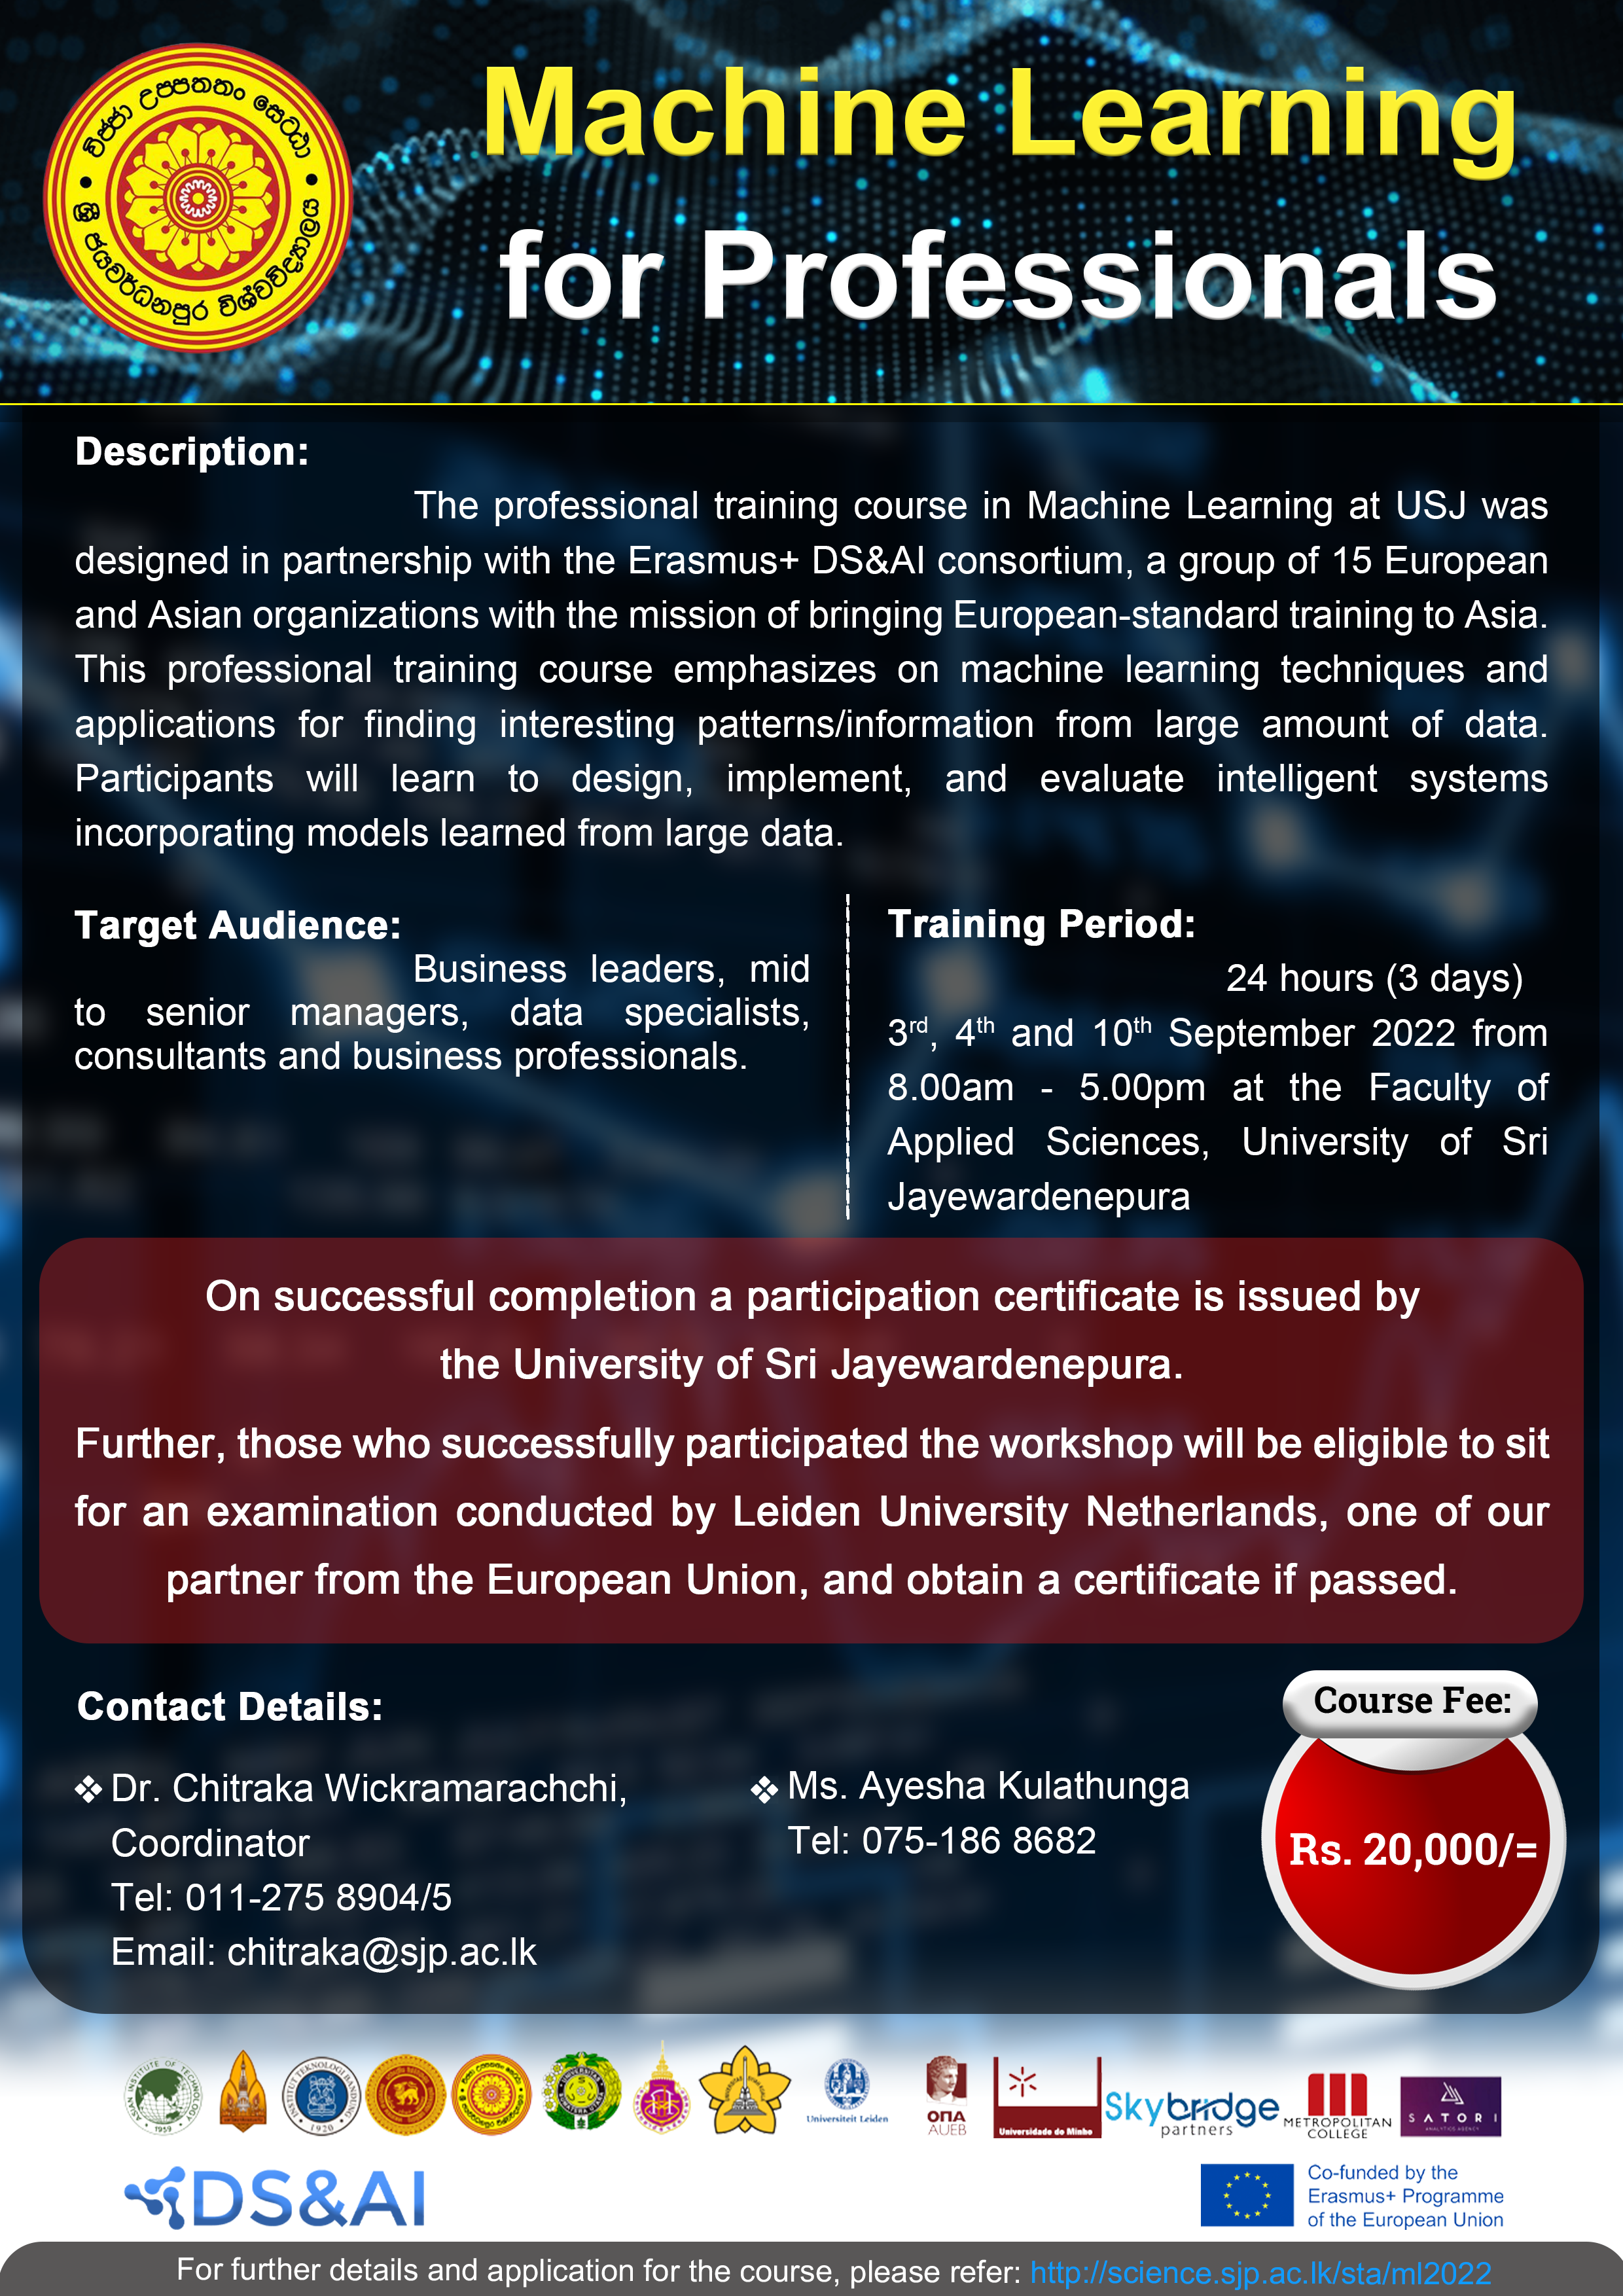
Description:
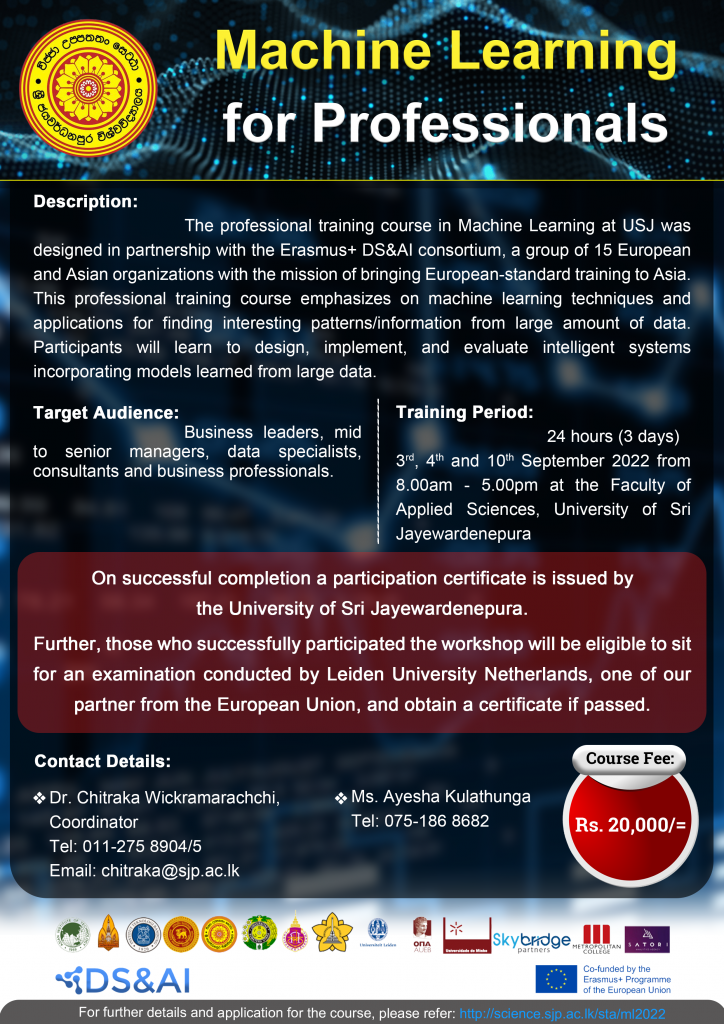
The professional training course in Machine Learning at USJ was designed in partnership with the Erasmus+ DS&AI consortium, a group of 15 European and Asian organizations with the mission of bringing European-standard training to Asia.
This professional training course emphasizes on machine learning techniques and applications for finding interesting patterns / information from large amount of data. Participants will learn to design, implement, and evaluate intelligent systems incorporating models learned from large data.
Target Audience:
Business leaders, mid to senior managers, data specialists, consultants, and business
professionals.
Training Period: 24 hours (3 days)
3 rd , 4 th and 10 th September 2022 from 8.00am-5.00 pm at the Faculty of Applied Sciences,
University of Sri Jayewardenepura
Course Fee: Rs. 20,000/=
Payment should be made via https://payments.sjp.ac.lk/
(State “Machine Learning for Professionals” in the “pay for” box on the payment gateway)
Apply for the course via Google Form
On successful completion a participation certificate is issued by the University of Sri
Jayewardenepura.
Further, those who successfully participated the workshop will be eligible to sit for the
examination conducted by Leiden University Netherlands, one of our partner from the
European Union, and obtain a certificate if passed.
Download the course syllabus
If you require any further information, feel free to contact
Dr. Chitraka Wickramarachchi
Coordinator of the programme
(chitraka@sjp.ac.lk)
or
Ayesha Kulathunga
Tel: 0751 86 86 82
Coordinator assistant