Higher Education webinar; Lay the foundation to an enlightening adventure
The thinking process of a recent Statistics graduate would likely go along the lines of “now that I’ve completed my bachelors, do I apply for higher studies and pursue an academic career or do I join headfirst to the workforce?”. However, being presented with multiple crossroads can be daunting at times. Therefore educating them on what to expect when applying for higher studies can help shed some light on untangling the uncertainty of their future prospects. With this objective in mind, the Statistics Society of University of Sri Jayewardenepura organized a higher studies webinar; a knowledge sharing session from the university alumni to the undergraduates of the Faculty of Applied Sciences. This event was a continuation of the webinar on higher studies that first took place in 2021.
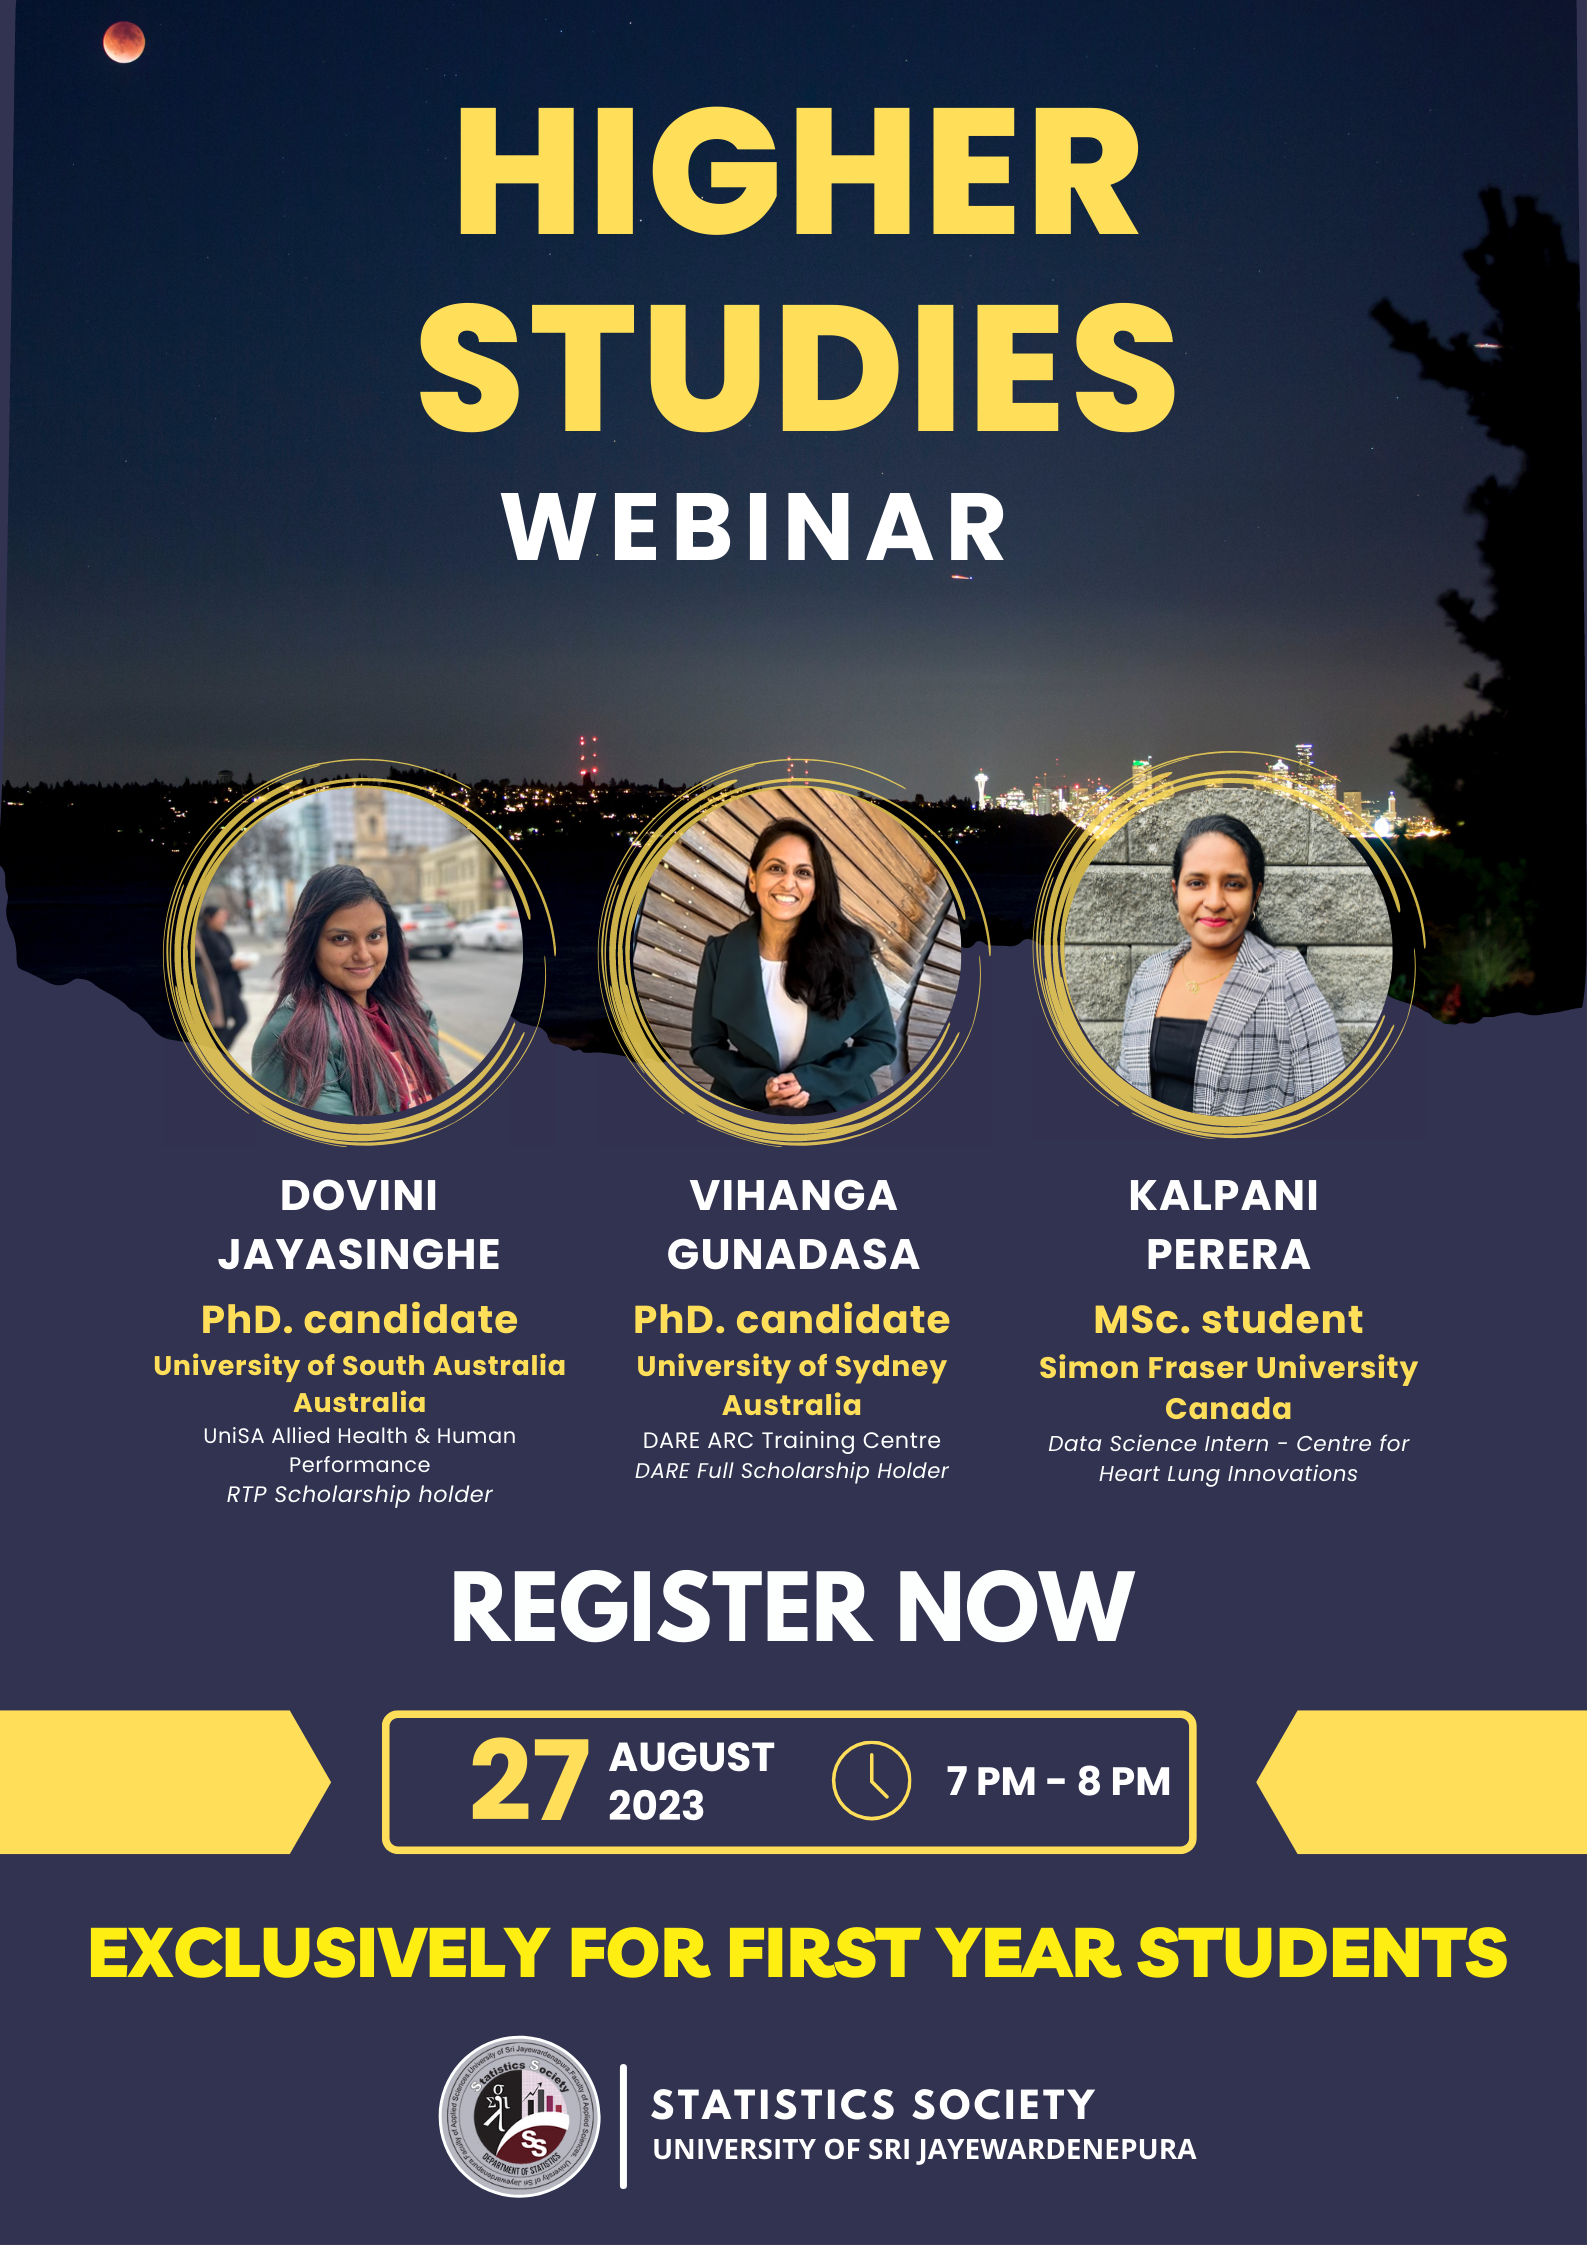
The higher studies webinar was successfully held on 27th August 2021, 7.00 PM onwards via Zoom with over 150 participants from all years who joined with the sole purpose of educating themselves about the opportunities that lie ahead of them in Sri Lanka and overseas. The speakers of the webinar were Ms. Vihanga Gunadasa (PhD. candidate at University of Sydney, Australia), Mrs. Dovini Jayasinghe (PhD. candidate at University of South Australia, Australia), and Mrs. Kalpani Perera (Msc. student at Simon Fraser University, Canada), who collectively shared their diverse overseas experiences on both academic and non-academic aspects.
The session started with the speakers addressing their own unique takes on managing time as an undergraduate and other general queries. In addition to the topic time management, the speakers shared their personal experiences on the level of grades and other academic qualifications that undergraduates are expected to maintain to be eligible for higher studies in foreign universities. Among other topics, the differences between different types of PhD programs and scholarships were also discussed. Finally, insights on the different outbound activities and the leisure time that is available for graduate students was shared through speakers’ personal experiences. Through this, the importance of prioritizing mental health and communicating effectively with supervisors was harped on, highlighting not only on academics but on the overall well being of higher studies candidates studying around the globe.
We thank Ms. Vihanga Gunadasa, Mrs. Dovini Jayasinghe and Mrs. Kalpani Perera from the bottom of our hearts for accepting our invitation and dedicating their precious time to inspire our fellow undergraduates. Our gratitude also extends to Dr. Rajitha Silva for his utmost support and guidance given to us in organizing the webinar and finding the right resources. We convey our thanks to the Executive Board and members of the Statistics Society for organizing and facilitating this knowledge transfer and finally all the participants for taking part in this event and sharing their queries and feedback.
Written by : Ms. Maleesha Panangala & Mr. Janith Wanniarachchi
Executive Board – 2020/2021
Statistics Society of University of Sri Jayewardenepura
Keep in touch with us at; Facebook | LinkedIn